
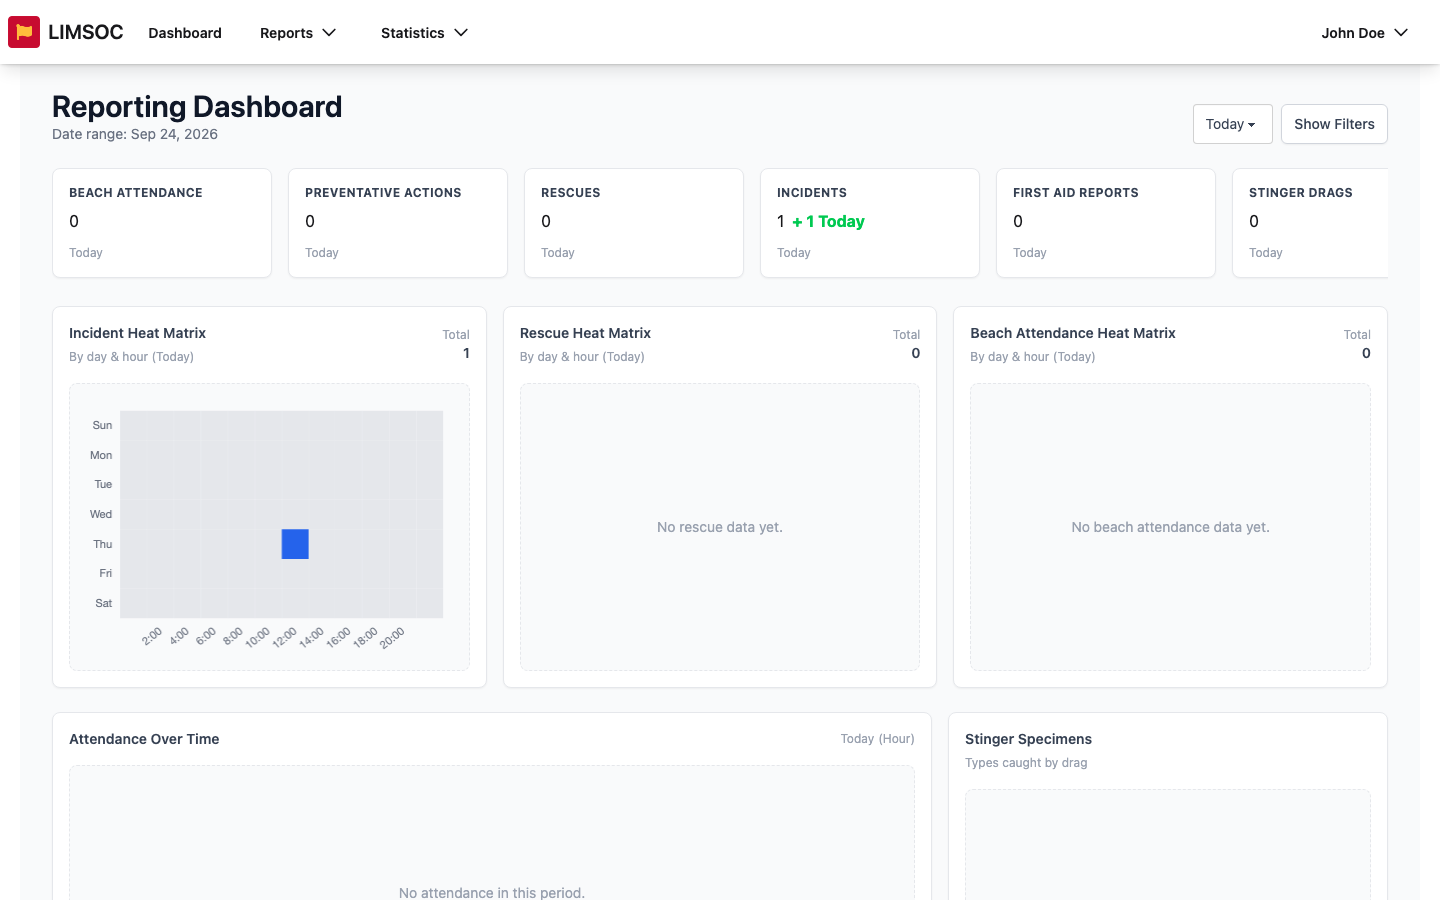
The Reporting Dashboard gives you a visual summary of activity across the units you're allowed to report on: attendance, preventative actions, rescues, incidents and first aids. It's the first screen you see in the Reporting interface, and it updates live as new records come in, so you don't need to refresh.
1. Open Reporting
From the LIMSOC landing page, choose the Reporting tile ("View unit and activity reporting"). Club admins can also get there from the Service Reports card. If you don't see the Reporting tile, you haven't been given reporting access. Ask your administrator.
Across the top you'll find Dashboard, the Reports menu (the detailed tables) and the Statistics menu.
2. Pick a period
Use the period button in the top-right (it starts on Today) to choose Today, Yesterday, This Week, Last Week, This Month, Last Month, This Financial Year, Last Financial Year, or a specific Financial Year / Quarter. The dates covered are shown under the heading as Date range. See Choosing a Date Period for how financial years and quarters work.
3. Read the tiles
The row of tiles shows totals for the period: Beach Attendance, Preventative Actions, Rescues, Incidents and First Aid Reports, plus Stinger Drags where your organisation records stinger drags. A green + N Today shows how many of those were added today.
4. Explore the charts
Heat matrices (Incident, Rescue and Beach Attendance) show when activity happens by day of the week and hour of the day. Darker squares mean busier times.
Over Time charts (Attendance, Incidents, Rescues) show the trend across the period, grouped by hour, day, week or month depending on how long the period is.
Donut charts break down First Aid Severity (major vs minor), Rescue Method and, where used, Stinger Specimens.
The Incident & Rescue Heatmap plots where incidents and rescues happened. Tick Incidents and/or Rescues to choose what's shown.
A message such as No rescue data yet. just means there's nothing recorded for that chart in the period you've chosen.
5. Narrow it down
Click Show Filters to focus on particular units, unit types, areas or LGAs. See Filtering the Dashboard.
Good to know
The dashboard can't be exported. For figures you can download, use the reports under Reports or Statistics.
Each tile only counts records you have reporting rights for, so you might see incidents but zero rescues if you can only report on incidents. See Why You Might See Different Report Data.